Speeding Things Up
As of my last post (yesterday), I was trying to figure out a way to rapidly obtain large numbers of GO IDs. Last time, I used Sam’s shell script by calling it inside a Jupyter notebook. However, Sam’s script took an extremely long time to run. A rough ballpark: for my 2 analyses (each with ~120,000 accession IDs), it would take a total of about 8 days on my local machine. That’s a huge pipeline bottleneck, and so we found an alternative.
New Script for Uniprot to GO
I created an R script for obtaining GO terms from accession IDs. Downside: it requires you to manually download the SwissProt database - with all GO terms included - from https://www.uniprot.org/uniprot/. Upside: it’s much, much, much faster. It ran in a few minutes, which by my calculation, is a bit faster than 8 days.
After getting GO terms, you need to remove duplicate lines prior to inputting to GO-MWU. So after using the R script (if you choose that path), switch over to the other script and begin running the analyses.
Using Sam’s shell script is probably still preferable if you’re looking at small numbers of genes or have a really fast internet connection. Otherwise, the new R script is likely preferable.
Running GO-MWU
Once I got past that bottleneck, I ran GO-MWU on my two analyses.
Reminder of what those analyses consisted of:
-
Elevated Day 2 individual libraries vs. Ambient Day 0+2 individual libraries
-
Ambient Day 0+2+17 libraries + Elevated Day 0 libraries + Lowered Day 0 libraries vs. Elevated Day 2 libraries. Reminder: Day 0 samples were taken while all crabs were still held at ambient temperatures.
Here are my results for each comparison:
Elevated Day 2 vs. Ambient Day 0+2, individual libraries
[Hierarchical clustering tree](https://github.com/afcoyle/hemat_bairdi_transcriptome/blob/main/graphs/GOMWU_output/cbai_transcriptomev2.0/elev2_vs_amb02_indiv.png.
- Red = up-regulated, blue = down-regulated (up-regulated = higher at elevated)
- Fraction: number of “good candidates” relative to total num of genes in category. A “good gene” is one with an unadjusted p-value <0.05.
Table of reformatted and augmented GO terms
Dissimilarity matrix of GO categories
Ambient Day 0+2+17 + Elevated Day 0 + Lowered Day 0 vs. Elevated Day 2
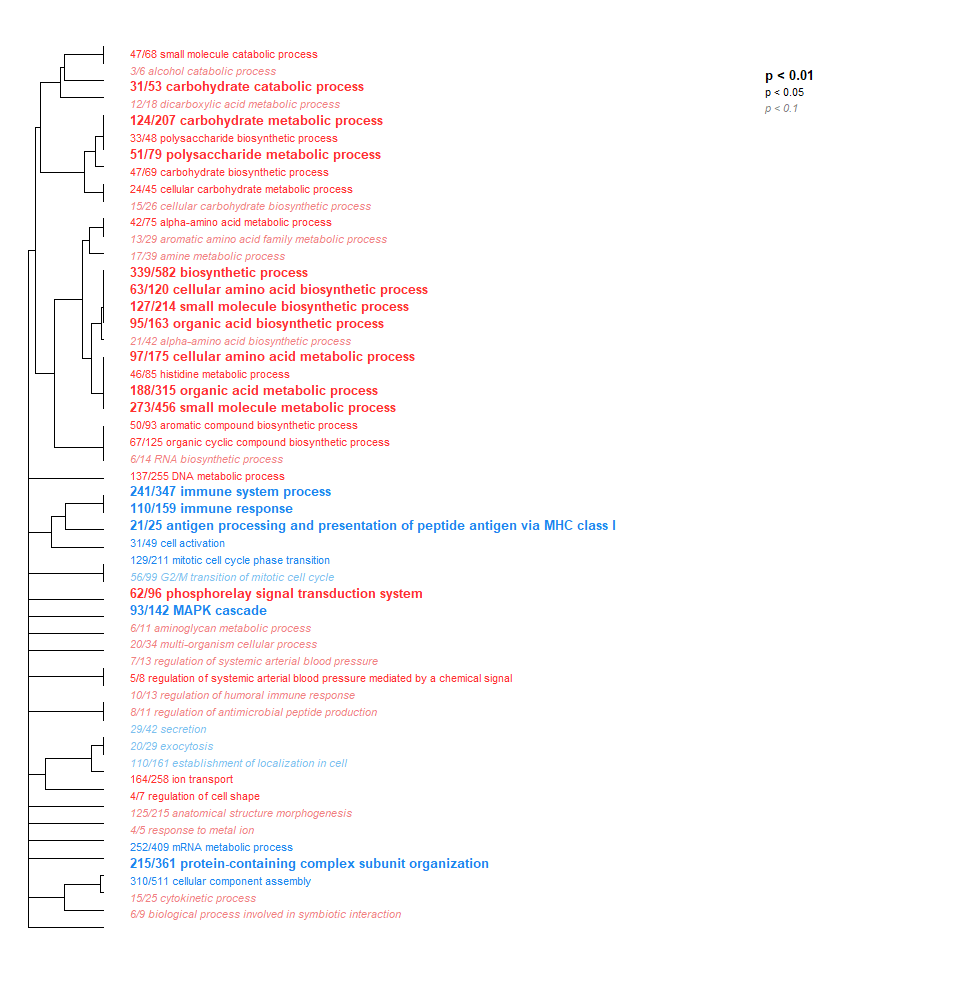
Table of reformatted and augmented GO terms
Dissimilarity matrix of GO categories
Quick Conclusions:
It sure looks like the first comparison gave more meaningful results than the second comparison. This could be because we sampled the same crabs in both groups (e.g. a sample of Crab G on Day 0 is part of the Amb Day 0/2/17 + Elev Day 0 + Low Day 0 group, a sample of Crab G on Day 2 is part of the Elevated Day 2 group).
It might be worth redoing this latter analysis with the Elevated Day 0 crabs dropped from the ambient treatment group altogether. Alternately, it may be neat to look at Elevated Day 0 vs. Elevated Day 2 - essentially, a pure examination of the effects of temperature on the same crab