Alright buckle up, it’s going to be a really really long one. But I promise, tons of cool stuff here.
Alright, so last time, I was fixing my GO-MWU analyses by switching over from adjusted p-value to log2 fold change.
Most of my time since then has been spent on three things: - Examining decreased-temp libraries with DESeq2 and GO-MWU - Re-running WGCNA with signed networks and binarized variables - Analyzing significant WGCNA modules with GO-MWU
1: Running DESeq2 and GO-MWU Comparisons on Decreased-Temp Libraries
I more or less ignored those when I was solely examining infection through a cPCR lens. However, since then, I’ve learned some info that’s made me a lot more confident about qPCR and less about cPCR. If we trust qPCR (which I do at this point), then examining our decreased-temperature results becomes a lot more important. It also lets us examine an experimental group over the full 17-day experimental period, rather than being confined to the 0-2 days (as all elevated-temp crab died before the Day 17 samples).
As a result, I ran 4 pairwise comparisons with DESeq2.
-
Low Day 0 vs. Low Day 2. Analogous to our Elevated Day 0-2 comparisons. Looks at short-term thermal adaptation in response to a sudden shift in temp. As a reminder, temperature was changed over a two-day period, so these samples are from the start and end of that change.
-
Low Day 0 vs. Low Day 2 + 17. Since these are the same crab, we’re essentially looking at our 3 ambient-temperature (Day 0) libraries vs. the 6 libraries from when crabs were at lowered temperatures.
-
Low Day 2 + 17 vs. Ambient Day 2 + 17. Here, we vary the crab, but keep the days identical, so removing one variable and adding another. Since we’re switching up the crab, this makes me a little bit iffier than simply keeping crab constant.
-
Low Day 0 + Ambient Days 0 + 2 + 17 vs. Low Day 2 + 17. This is really taking all ambient- and low-temperature libraries from the two treatment groups. Again, adding the variable of crab, but giving a bit larger sample size for the ambient-temperature sample size.
Results:
DESeq2:
-
Got some DEGs, but nothing interesting as far as PCAs go.
-
While running, noticed that I’ve been setting my adjusted p-value for significance to p <= 0.005. Grace’s methods set it to 0.05, and that seems pretty standard. We haven’t been doing anything with our DEGs specifically (GO-MWU and WGCNA both analyze all genes instead of just looking at DEGs), but certainly worth noting.
GO-MWU:
Parasite Transcriptome
- Low Day 2 + 17 vs. Ambient Day 2 + 17: Some pretty neat changes between these groups. However, it’s worth noting that when I ran a further analysis of Low Day 0 vs. Ambient Day 0, there were a lot of differences in GO term enrichment as well. So this could be solely due to differences in baseline crab expression. The two graphs are linked below:
 .
.
- Low Day 0 + Ambient Day 0 + 2 + 17 vs. Low Day 2 + 17: Again, substantial differences in enrichment. However, as mentioned above, could be due to crab effects alone.
Host Transcriptome
- Just like the parasite transcriptome, Low Day 2 + 17 vs. Ambient Day 2 + 17 had some interesting stuff, albeit less. However, I didn’t get around to running the Low Day 0 vs. Ambient Day 0 to validate that it’s not crab effects - that’s next on my to-do list.
Mixed Transcriptome
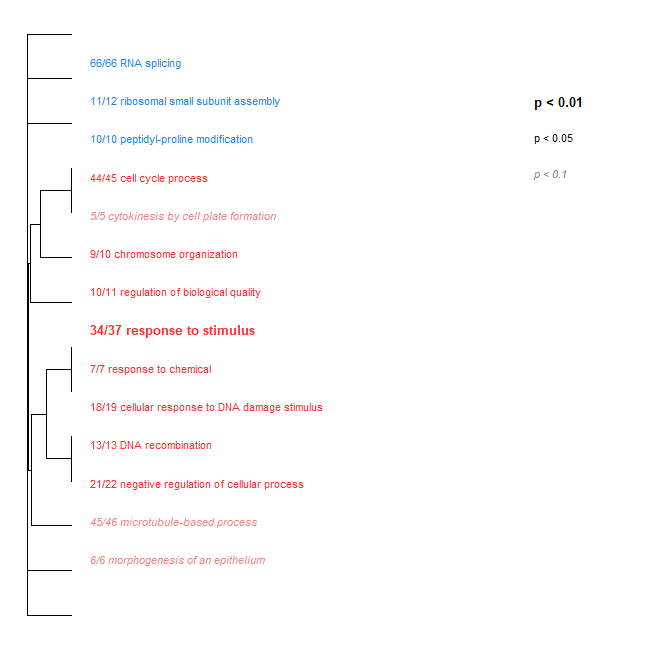
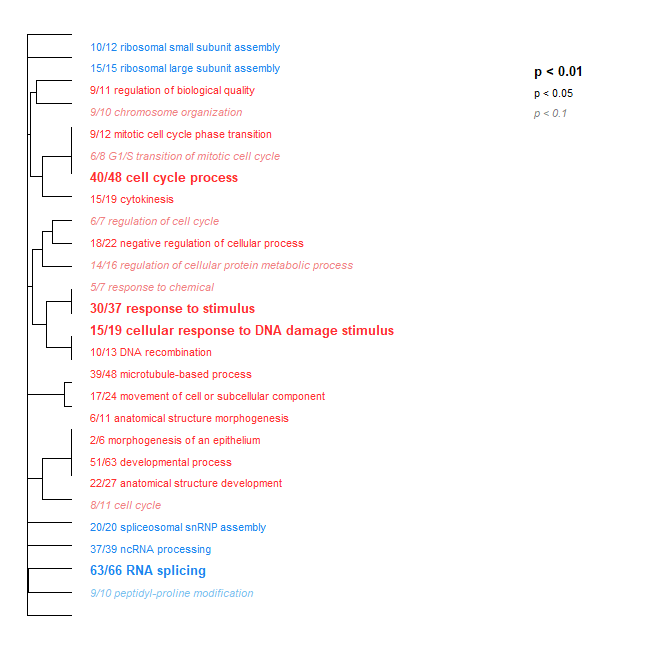
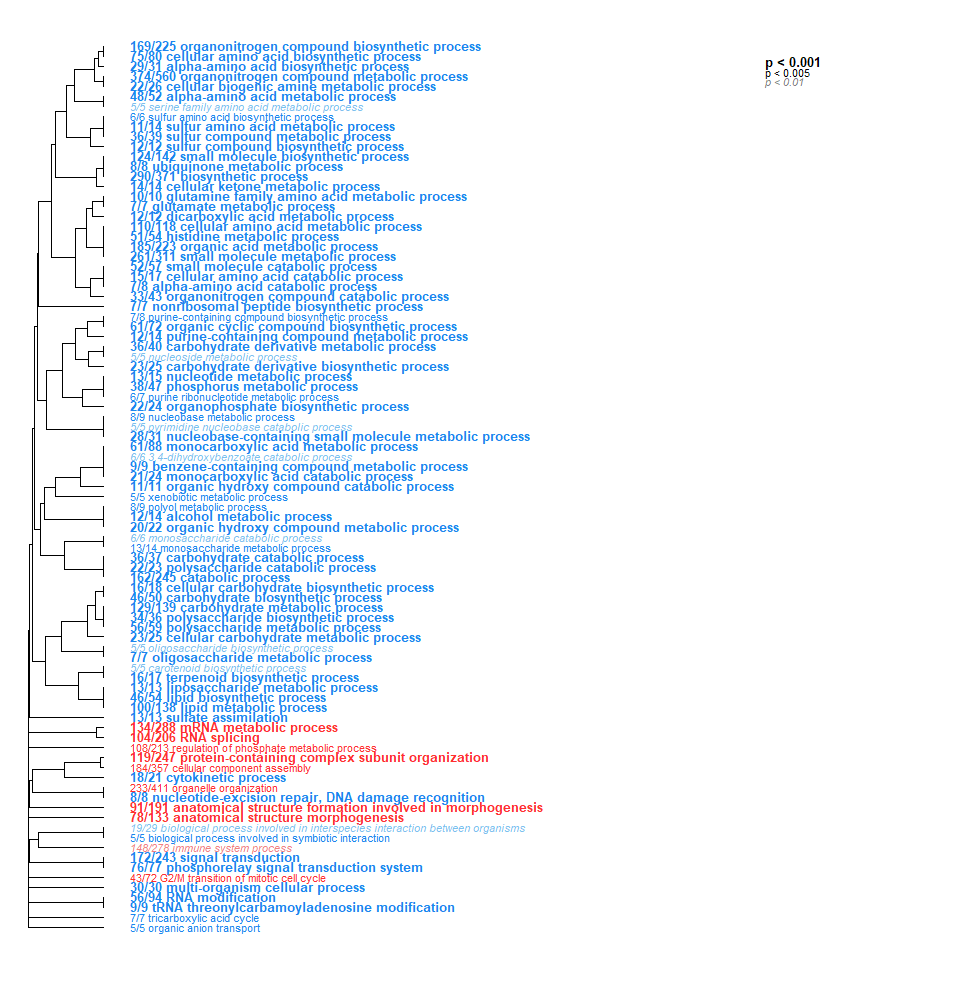
- Low Day 0 vs. Low Day 2: TONS of interesting stuff here! So much that I had to drop the p-value significantly just to visualize it all. Here you go - check it out!!
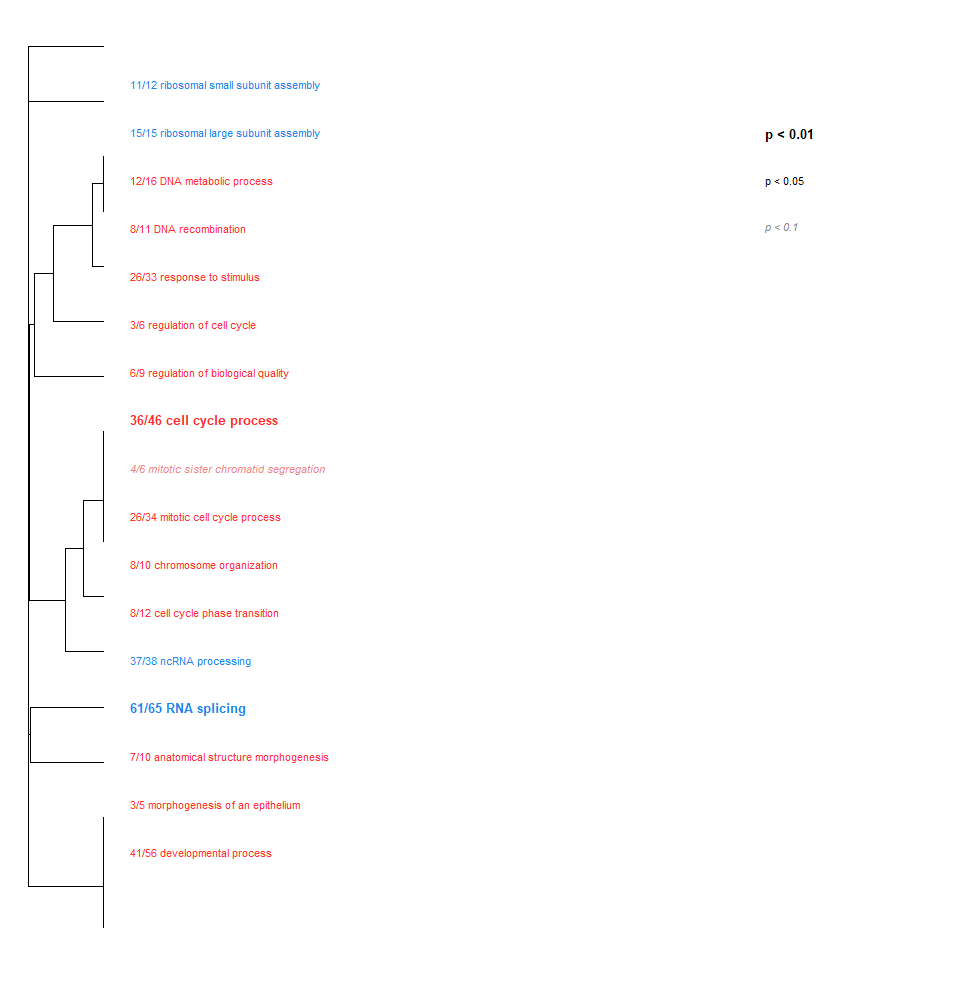
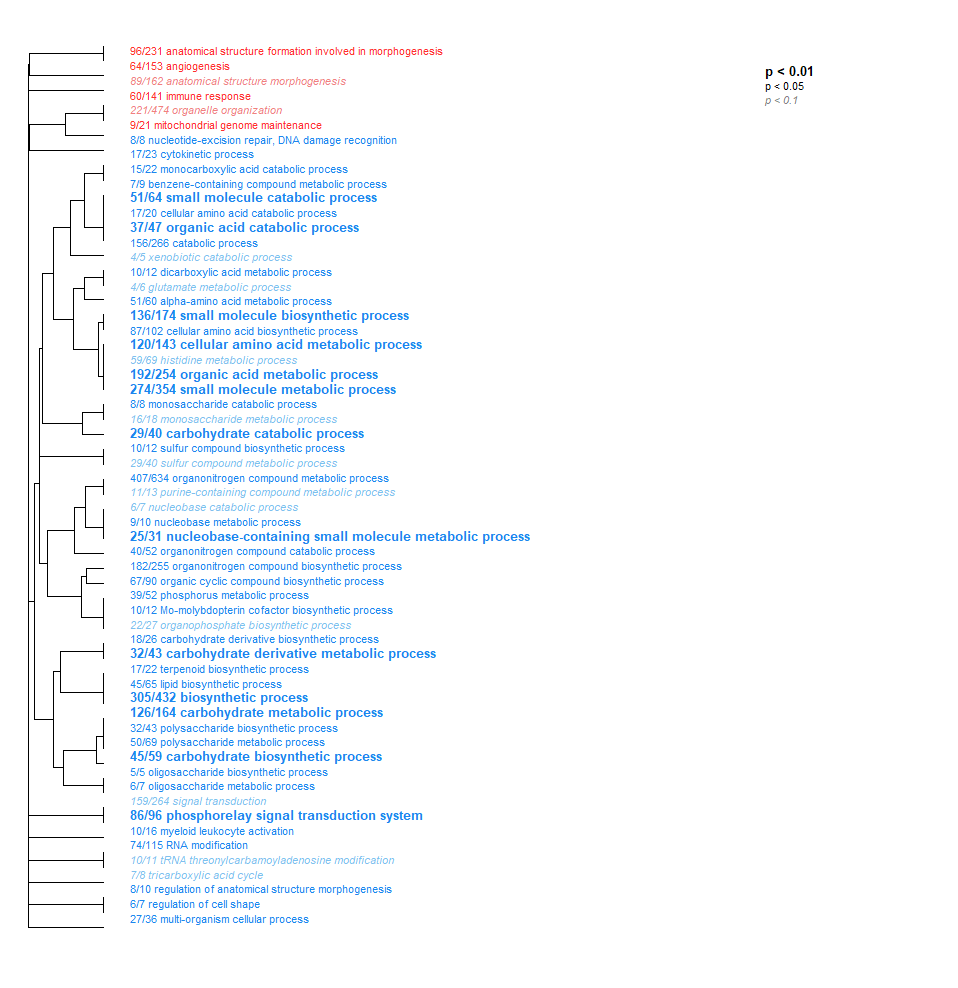
- Low Day 0 vs. Low Day 2 + 17: Less than Low Day 0 vs. Low Day 2. But still a bunch of cool stuff! Note the broad downregulation of all these categories (color represents the direction, but just as a binary - up or down). We saw the same in Day 0 vs. 2.
-
Low Day 2 + 17 vs. Ambient Day 2 + 17: Not going to put the image in to avoid cluttering things up, but same overall pattern - general downregulation, lots of processes involved. You can see it here
-
Low Day 0 + Ambient Day 0 + 2 + 17 vs. Low Day 2 + 17: Again, skipping the image because this is really the least meaningful comparison to me, but a bunch of neat stuff here. Note that it’s an exception to our overall downregulation - we’re seeing a mix of up- and down-regulation. Another indication that it might be iffy to look at the effect of both crab and day simultaneously. Also, note the bottom two there - “viral process” and “viral tail assembly”. Definitely pretty interesting, and indicates there might be some other cool stuff going on there with other possible parasites (yes I count viruses as a parasite).
2: Re-running WGCNA as signed and with binarized variables
Previously, we ran WGCNA to group genes into networks and associate them with variables. However, that had three problems. First, as this post from one of the creators of WGCNA details, signed networks are generally preferred to unsigned, which we initially ran. Second, we didn’t binarize our variables. For non-binary variables (such as Crab ID, where we have 9 possibilities), we should first binarize them. Check out this post, by the same person, for an explanation on why. And third, we didn’t extract kME values (or module membership values) for further analysis with GO-MWU.
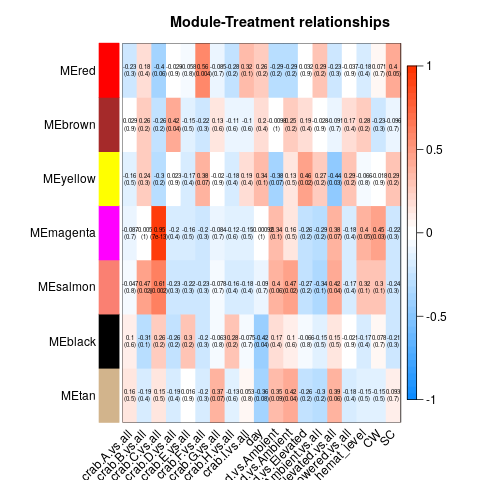
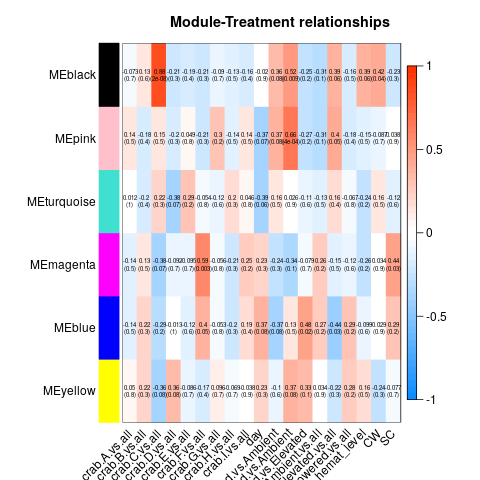
So essentially, we had to re-run all our WGCNA analyses in which we fixed the above problems. These produced a series of significant modules (different from those before). Those are detailed at the start of this script. I’ll also post the heatmap for each transcriptome below (unfiltered, host, then parasite). Some of the variables are hard to read, so here’s the order of the columns after day:
- Elevated vs. Ambient
- Lowered vs. Ambient
- Lowered vs. Elevated
- Ambient vs. All
- Elevated vs. All
- Lowered vs. All
- Infection (readable after here)
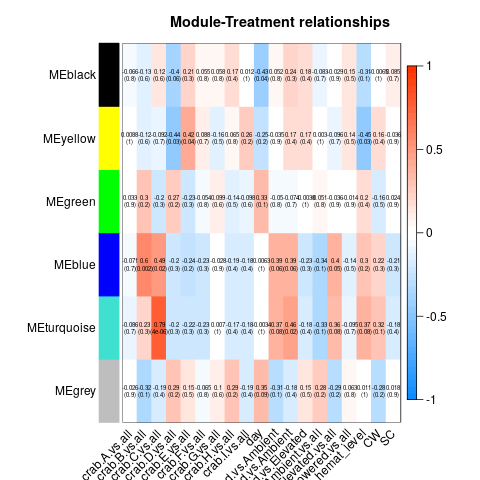
Of all the significant modules from all these transcriptomes, we discarded all those that appeared to be due to the influence of a single crab (i.e. the effect is from the crab, not the actual variable). That left us with a series of modules that we analyzed using GO-MWU (again, module choice is detailed in this script)
That leads us to…
3: Analyzing WGCNA Clusters with GO-MWU
The kME values were extracted from each WGCNA run for the significant modules. GO terms were obtained, and kME values for genes not in the significant module were set to 0.
No modules deemed significant in either the unfiltered or host transcriptomes had any significant GO term enrichment. However, all three parasite modules did! They are pictured below.
Linkages are to the following variables (in order of appearance as well):
- Black module: Linked to day
- Blue module: Linked to hematodinium level
- Turquoise module: Linked equally strongly to temperature (Low vs. Amb) and hematodinium level
[NOTE: Due to a subsequent re-running of WGCNA with hemat_level set to continuous, module names and contents changed. Please see the next notebook post for updated results.]
Of these, we’ve got some interesting results!!
-
Within the parasite, it appears that the strength of the infection is correlated with a response to overall stress and specifically to decreased oxygen levels.
-
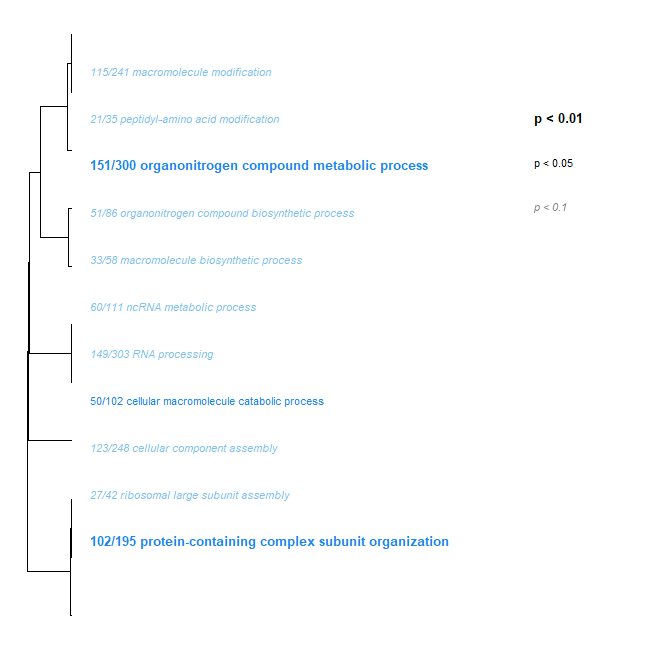
Temperature and hematodinium level (combined) are heavily linked to ribosomal activity and microtubule cytoskeleton organization within the parasite. There are also links to spliceosomal snRNPs, which with a quick google appears that it may be involved in RNA modification.
To me, this appears to be the neatest result so far. Definitely worth further investigation and probably a more thorough writeup.
Other Misc Stuff:
-
Talked with Chelsea Wood, and she’ll be joining my committee! Should be great for giving my stuff a more thorough grounding in the ecological side of things.
-
Talked with Madi Shipley, got some great info about the NPRB plans, and will be joining the BSFRF meeting in December
-
Talked with Pam Jensen (in person this time), and got a completely full tote of notebooks - describing most of what Pam worked on at NOAA along with all the hard copies for the extraction plates and gel runs. Will be taking a deeper dive into this in a later post.
Alright, it’s been a busy week. Time for…another busy week?!?!
Next Steps:
- Run DESeq2 comparisons on the following:
- Low Day 0 vs. Low Day 17 (all transcriptomes)
- Low Day 0 + Ambient Day 0 vs. Low Day 17 + Ambient Day 17 (all transcriptomes)
- Low Day 0 vs. Ambient Day 0 (unfiltered and host transcriptomes)
-
Write up notebook post on chat with Pam + her notebooks
-
(potentially, talk to Steven first): Use WGCNA to locate genes with a high GS and MM scores within significant modules. This indicates they’re influential within these pathways.
- WRITE UP ALL RESULTS AND METHODS!!!!