Alright, last time I found a bunch of cool stuff by re-running with signed modules. Before I get into my goals, let’s recap those:
WGCNA
Previously, I switched from an unsigned to a signed network. After doing so, I realized that it would be optimal to use hemat_level as a continuous, rather than categorical, variable. I’d set it up as categorical earlier, simply because samples either had a quite low SQ mean (sub-5000) or quite high (over 100,000). However, I figured hey, why not have the extra precision of treating it as continuous! So I re-ran WGCNA with that input changed, and definitely got some differences. Nothing major, just some changes in module names and contents.
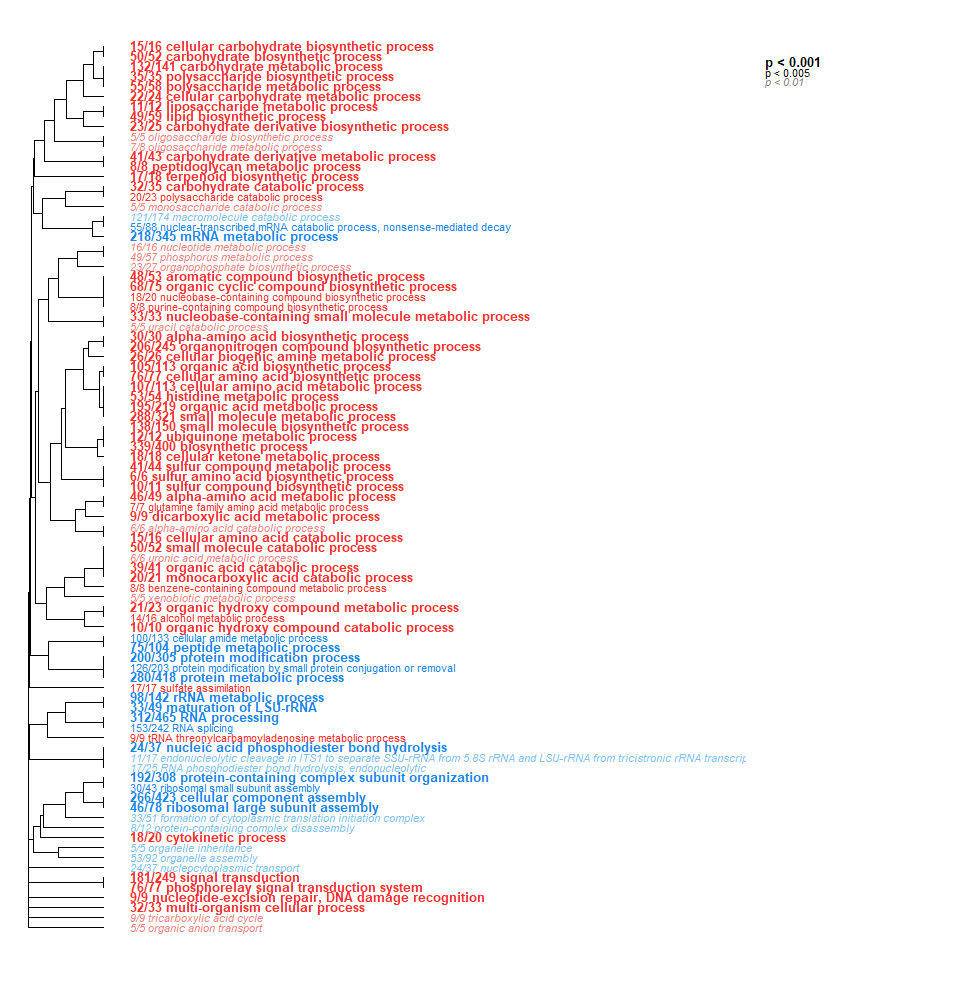
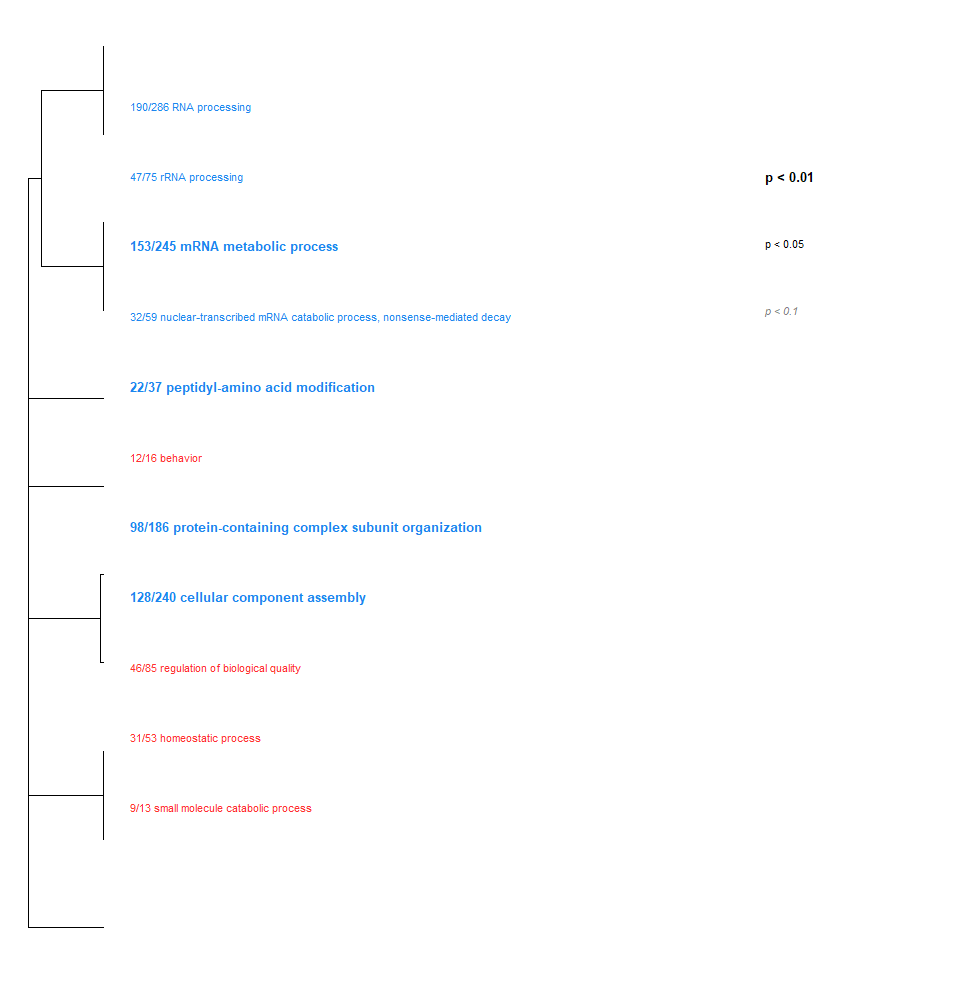
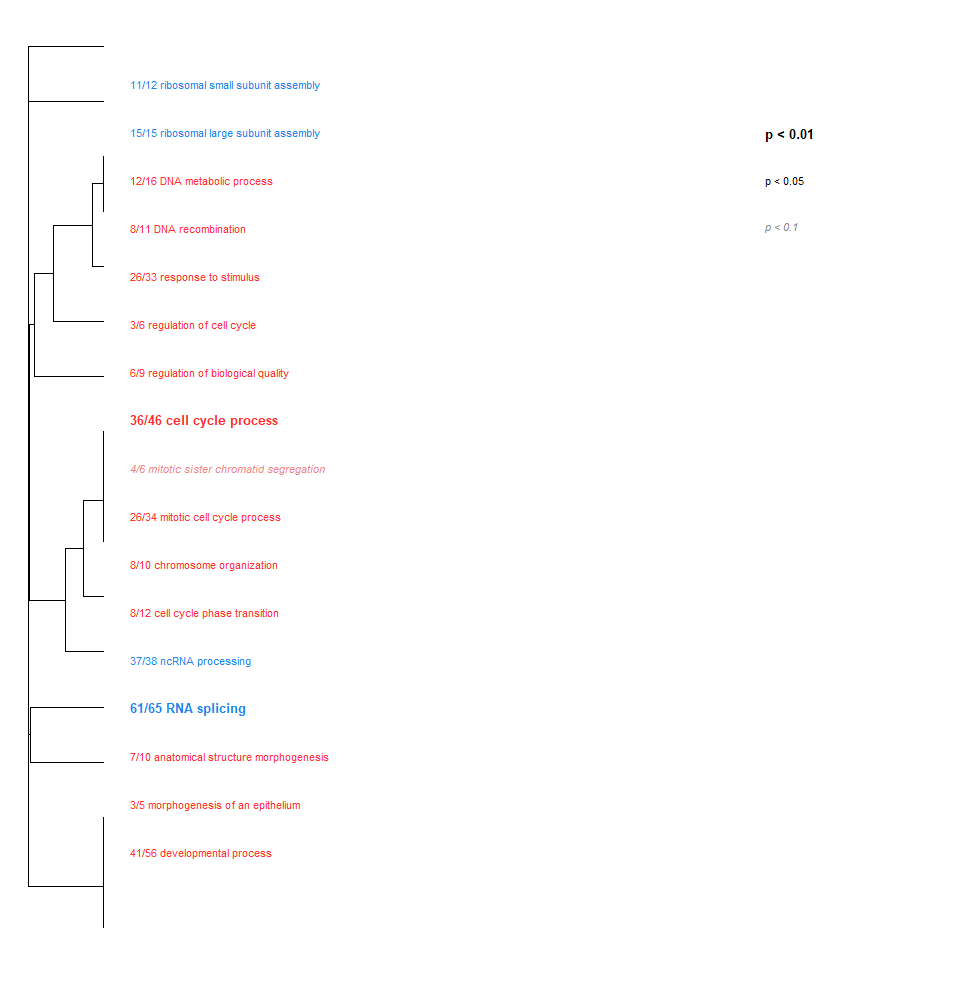
After discarding significant modules in which there was high correlation to a single crab, I examined significance with GO-MWU. No enrichment was detected in any GO module within the host or complete transcriptome. However, when analyzing the parasite transcriptome, I got  within a significant module.
Oh also, as a note, I’m now using a different, more paper-friendly notation for the transcriptomes.
- cbai_transcriptomev2.0 is now the complete transcriptome
- cbai_transcriptomev4.0 is now the Tanner crab transcriptome
- hemat_transcriptomev1.6 is now the Hematodinium transcriptome
Just thought I’d note that in case it’s important!
Additional DESeq2 Runs
-
I ran DESeq2 and GO-MWU on Decreased Day 0 vs. Decreased Day 17 (all transcriptomes). Visualization of enrichment not available due to lack of significance, but results available for complete, Tanner crab, and Hematodinium transcriptomes.
-
I ran DESeq2 and GO-MWU on Decreased Day 0 vs. Ambient Day 0 (all transcriptomes).
Main takeaways:
- Minimal change over time in the decreased-temperature treatment group
- Lots of baseline differences between expression in the Decreased and control groups
Correcting DESeq2 Levels:
I noticed that previously, I had set the DESeq2 bar for a DEG at padj = 0.005. However, that’s a bit unreasonably low - instead, I raised it up to padj = 0.05. This gave us more accurate totals for DEGs among each pairwise comparison. However, it also required us to re-run all DESeq2 comparisons (which is a whole lot - 30+ among all transcriptomes!). Once it finished running, we were able to produce accurate tables of DEGs for each pairwise comparison.
Miscellaneous Others:
- I transferred my paper draft over from R markdown to Google docs
- Did some fairly extensive reformatting and writing. Still some work to do on results + discussion, but making progress!
- I’ll be TAing for Jose Guzman next quarter in his FISH 270 course!
Alright, that’s my recap sorted. Time to talk about DECEMBER GOALS!
Goals:
-
Write the dang paper! By the end of the month, I want to have finalized the methods and results (currently in progress), and made serious progress on the intro and discussion. My goal is to finalize either the intro or discussion by the end of the month.
-
Write up a notebook post on Pam’s notebooks
-
Participate in the Chionoecetes workshop that BSFRF is setting up!
-
Go through Pam’s notebooks, see what samples would be optimal to work with
-
Only if we want additional results: Talk with Steven about using WGCNA to locate genes with a high GS and MM scores within significant modules. This indicates they’re influential within these pathways.
-
Have a wholesome and cozy holiday season
Alright, that’s my goals for the next month! A bit optimistic, given that a good portion of December is the holidays, but it’s crunch time - gotta wrap things up on this paper ASAP!