Monday, Dec. 5th
Happy holidays - first post of December! Took the first few days of the month off to head back to Cleveland (congrats on the wedding, David!). To recap, I’ve got two papers that I’m working on at the moment. First, a paper examining the relationship of various environmental and physical variables to visual BCS positive C. bairdi by using GLMMs on a huge ADFG dataset. This is the focus of most of my work at this point - I’m in the writing up stages! The second is a paper that uses RNAseq to examine the response of infected C. bairdi to short-term temperature changes. I’ve submitted this one to Frontiers in Marine Science, but still have edits to make. My to-do lists for each task is below:
Modeling Visual Positives:
-
For each final weighted model, create graph of each variable’s relationship to bitterness
-
Upload existing graphs to GitHub (currently have some locally on Raven)
-
Plot raw data of temperature vs. bitterness (it’s tightly correlated in my current model, so having this additionally just makes my data a bit more convincing)
-
Continue writing up results and discussion
-
Outline introduction
-
Ensure all saved models were successfully stored on GitHub (this was the task I completed last - ran into some Git issues while uploading, want to check all was resolved)
Examining Short-Term Temperature Response:
-
Figure out issues related to uploading data - I’m using data that was previously uploaded by Grace, need to figure out how to link this.
-
Get confirmation that ethics approval wasn’t required for this study. Should likely email the journal for confirmation that “I was just looking at crabs” is adequate, potentially with a link to UW ethics guidelines.
-
Set up structure where I methodically lay out reviewer comments and my existing paper in the Google doc, start fixing up. Note: I’ve heard back from Reviewer 1 but not Reviewer 2.
-
Start fixing up graphs to be paper-quality
Alright, that’s about it - let’s get started, and here’s to a productive month!
Thursday, Dec. 8th
Alright, worked to plot the raw data of temperature vs. bitterness, and the story is…complicated! Again, my model shows a really strong positive relationship between temperature and bitterness - the warmer the water, the more likelihood the crab has BCS. However, when I just graphed temperature vs. bitterness, I saw the exact opposite!
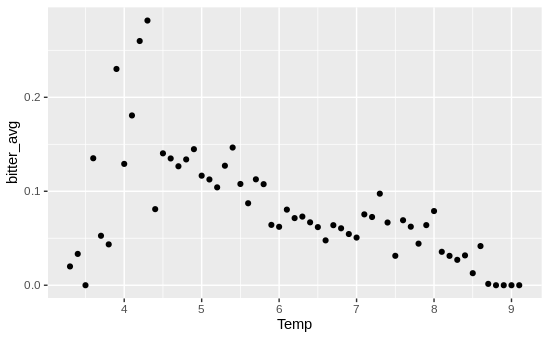
Note: each data point is each 0.1 degree interval - if, say, there were 10,000 crabs caught at 6.2C and 1,000 were infected, that would be a single data point at x = 6.2 and y = 0.1
Naturally, my first thought was “oh no my conclusions are trash and my model is broken and I’m useless”. To test that assumption, I built a tiny model with just BCS status, temperature, and our random effects (year and site). That model showed that there was still a strong positive relationship between temperature and BCS status!
![]https://raw.githubusercontent.com/afcoyle/hemat_modeling/main/output/ADFG_SE_AK_pot_surveys/diagnostic_images/only_temp_model.png
This seemed to indicate that one of the random effects was responsible here - in other words, temperature and bitterness within years or within sites might be positively correlated, even if negatively correlated overall. So I graphed the relationship between bitterness and temperature for each year, which gave me this graph
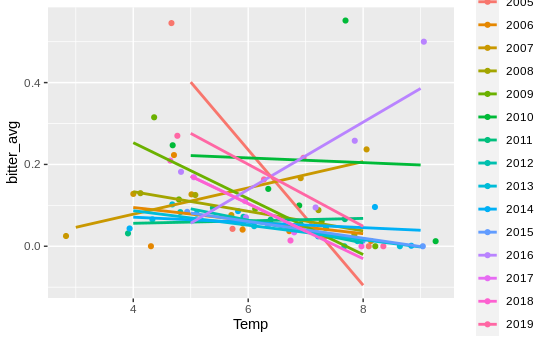
Basically, no relationship! I then moved on to site, and…
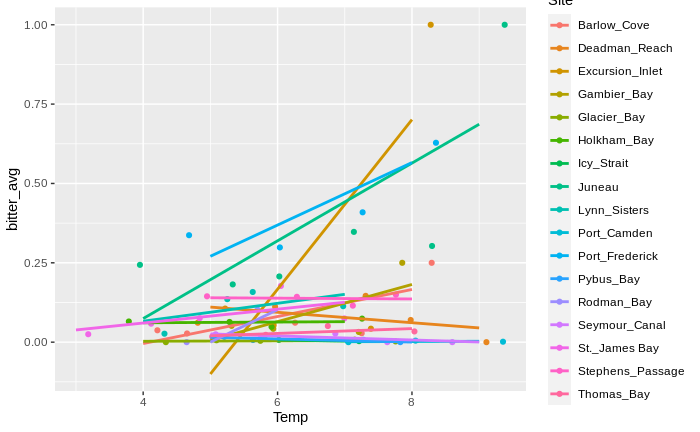
From this graph (which has one data point for each 1 degree interval per site), it looks like within the majority of sites, warmer waters = higher temperatures! In essence, the takeaway message seems to be:
At each site, warmer waters mean higher prevalence of BCS. However, warmer sites tend to have lower prevalences of BCS.
That’s definitely a more complex message than “warmer waters = more BCS”! I also need to do more of an in-depth dive to validate that. Next goal: create a separate graph of temperature vs. BCS prevalence for each site (with error bars!).