Wednesday, Jan. 3
Alright, after a busy quarter of TAing and making some progress on my work, it’s time to get back into the groove of daily notebook posts! New year, new me, new notebook routine.
Today was the first day of the quarter - had my first class (FISH 539, US fishery management policy with Anne Beaudreau), and introduced myself as the TA for FISH 270. It should be a pretty easy quarter of TAing, as this is the 3rd time I’ve TAed for 270, and like the fourth time I’ve TAed for Jose. Plus the other TA is Celeste, so that’ll be fun!
In actual lab things, my current task is to merge temperature info by site and year, so rather than each crab getting a measured temperature at the moment of capture (not necessarily the most biologically important), all temperatures for that survey area over the year will be averaged. That’ll give an idea of the sorts of general temperatures the crab is experiencing, which should be more impactful on Hematodinium development than a single point in time.
To do that, I’m going back to my old scripts and editing how I input temperature. But before I do that, I’ve gotta update my packages, as Tidyverse had some updates recently. It’s taking quite a while to update everything, so I’m just waiting around now. Should be a pretty straightforward process though!
Thursday, Jan. 4th
Spent the day updating R and RStudio and various packages. Also did a bunch of work for FISH 539!
Friday, Jan. 5th
Did the big thing!!! Changed how I input temperature so that each crab’s temperature column is equal to the temperature for that location for that year. Got the data table updated, along with all scripts up until the point of building the actual model! Ran into a roadblock there, as I was having problems getting into Raven. Sam helped me out, and I should be able to tackle that Monday!
Monday, Jan. 8th
Laid out timeline for graduation. Plan is as follows:
- Finish modeling by this Friday (1/12)
- Finish Chapter 2 (the modeling chapter) by Feb. 1st
- Defend on March 1st
- Quarter ends on March 15th
Need to clear it with Steven and then ensure Chelsea’s free those dates.
Additionally, got the Raven login all sorted out. Spent a while updating packages (for some reason, I can’t just run the same little script to auto-download and load packages on Raven, maybe something to do with permissions?). Now running the model - should be done tomorrow! In the meantime, I’ll shift focus over to working ahead for FISH 539 so I’m all clear to leap into writing up the model results once it finishes running.
Tuesday, Jan. 9th
Alright, ran the updated model, which uses the average temperature for each location for that year, rather than the momentary bottom temperature for the single pot in which the crab was caught! Some general takeaways:
- Very significant terms (p < 2x10-16) in order of magnitude of estimated coefficient:
- Shell condition
- Older = less likely to be infected
- Black Mat disease status (note: somewhat high standard error)
- Crabs with Black Mat were less likely to have BCS
- Sex
- Females were more likely to be infected
- CW
- Larger crabs were more likely to have BCS
- Depth
- Crabs were less likely to be infected at deeper depths
- Shell condition
- Significant terms
- Temperature (p = 0.01)
- Higher temperatures had increased risk of infection
- Temperature (p = 0.01)
- Non-significant terms
- Leg condition (p = 0.32)
- Latitude (p = 0.44)
Note: this model did NOT include Julian day, as the correlation between Julian day and temperature was ever so slightly above our bar for a Pearson’s test (bar for acceptable correlation is below 0.6, correlation between the two was 0.61)
Current to-do list:
- Run model on female crabs, on male crabs, and with maturity
- Run model one more time, but including Julian day
Wednesday, Jan. 10th - Fri, Jan. 12th
Taken out of commission by a mysterious illness! Oof, it’s been a rough few days, been sleeping like 18+ hours, sleep schedule wrecked, etc. Feeling better now though, and ready to make up for lost time!
Sunday, Jan. 14th
Coming in on a day off to run some of those models! Here’s the results for the model of female crabs
FEMALE CRABS MODEL RESULTS
- Very significant terms (p <= 3.0 x 10^-6) in order of magnitude of estimated coefficient:
- Shell condition
- Older = less likely to be infected
- Egg Percent
- Fuller clutch = more likely to be infected
- Carapace width
- Bigger crabs = more likely to be infected
- Shell condition
- Significant terms
- Depth (p = 0.001)
- Deeper = less likely to be infected
- Egg development
- Juveniles less likely to be infected (p = 0.028)
- No differences among mature females noted by egg condition
- Depth (p = 0.001)
- Non-significant terms
- Temperature (p = 0.25)
- Leg condition (p = 0.18)
- Black Mat (p = 0.18)
- Latitude (p = 0.51)
MALE CRABS MODEL RESULTS
- Very significant terms (p < 2.0 x 10^-6) in order of magnitude of estimated coefficient:
- Shell condition
- Older = less likely to be infected
- Maturity
- Mature = less likely to be infected
- Carapace width
- Bigger crabs = more likely to be infected
- Shell condition
- Significant terms
- Leg condition (p = 0.0009)
- Injured crabs = more likely to be infected
- Depth (p = 0.005)
- Deeper crabs = less likely to be infected
- Leg condition (p = 0.0009)
- Non-significant terms:
- Latitude (p = 0.95)
- Temperature (p = 0.41)
- Black Mat (p = 0.97)
Now running maturity model, will update when available!
Current to-do list:
- Finish run on maturity model
- Repeat model runs one more time, but with Julian day included
- Create summary tables of model results
- Which variables were very significant in each model?
- Idea: very significant = red, significant = yellow, non-significant = green, not included = white, not relevant = black (ex: sex in sex-specific models)
- Which variables were very significant in each model?
CRABS WITH MATURITY STATUS: MODEL RESULTS
- Very significant terms (p <= 3.0 x 10^-7) in order of magnitude of estimated coefficient:
- Shell condition
- Older = less likely to be infected
- Sex
- Female = more likely to be infected
- Maturity
- Mature = less likely to be infected
- Carapace width
- Bigger crabs = more likely to be infected
- Shell condition
- Significant terms
- Depth (p = 0.0003)
- Deeper = less likely to be infected
- Temperature (p = 0.002)
- Warmer = more likely to be infected
- Depth (p = 0.0003)
- Not significant terms
- Leg condition (p = 0.16)
- Black Mat (p = 0.33)
- Latitude (p = 0.68)
Monday, Jan. 15th
Alright, another day of catching up! Ran that final model, with Julian day included. Here’s the takeaways from that:
ALL CRABS, WITH JULIAN DAY INCLUDED: MODEL RESULTS
- Very significant terms (p < 2x10-16) in order of magnitude of estimated coefficient:
- Shell condition
- Older = less likely to be infected
- Black Mat disease status (note: somewhat high standard error)
- Crabs with Black Mat were less likely to have BCS
- Julian day
- Later in survey season = less likely to be infected
- CW
- Larger crabs were more likely to have BCS
- Sex
- Females were more likely to be infected
- Depth
- Crabs were less likely to be infected at deeper depths
- Shell condition
- Non-significant terms
- Leg condition (p = 0.31)
- Temperature (p = 0.77)
- Latitude (p = 0.94)
Overall, these results are really quite similar to the model with Julian day excluded, with the exception of some minor changes in p-value. Overall, glad I ran this one, but it really does seem like the model without Julian day worked just fine!
Quick note on the results from each model: the models on all crabs (both the standard and the model including Julian day) are based on huuuuge datasets. The others are much smaller. That substantially impacts p-values! For reference, here’s the number of observations per model (rounded):
All Crabs: 151,000 Female Crabs: 25,000 Male Crabs 24,000 Maturity-Status Crabs: 48,000
Note: in case a future reader needs clarification, the reason the All Crabs model is much, much larger than the sum of the sex-specific models is that the sex-specific models incorporate sex-specific measurements (clutch fullness and egg development for females, maturity derived via chela height ratio for males). Those sex-specific measurements were only taken on a subset of individuals in the survey.
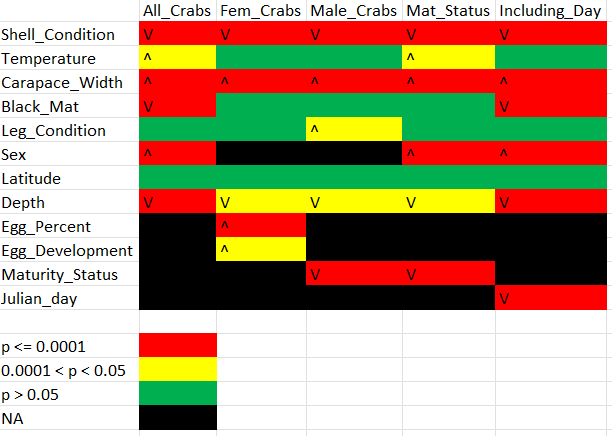
Now that I’ve finished all the modeling, I’ve created a quick and dirty summary table of those models, shown below. The V’s and carats indicate the direction of the relationship, just to verify consistency (if you’re confused for some, they’re based off the codes used, so, for instance, sex and BCS having a positive relationship is because the ADFG code for “male” is 1 and the code for “female” is 2)
Tues, Jan. 16th - Fri, Jan. 19th
Truly not that much to report, as far as research. Got a lot of class-related work done, both for the class I’m TAing and for the one I’m taking, and I should be good to go for the next few weeks on those things. I also covered for Celeste’s lab on Thursday (as she covered for me last Friday when I was sick), so haven’t had the most free time. Fingers crossed for next week being good!
Mon, Jan. 22nd
Pretty productive day! I got a lot of my results section ironed out, and though I still need to beautify my images, the text section is feeling pretty great. I also started outlining the discussion section, did some modifications to the outline of my intro, and got the first paragraph of my intro finished up! Goal is to finish the paper by next Wednesday - it’ll be a bit of a stretch goal, but I’ll try to make it happen!